I have a mentor who used to say, “It’s not what the data says, it’s what you do about what the data says that matters.” Whether students performed well or struggled on an assessment, this mantra always helped me shift to next steps with a feeling of ownership and optimism. Below are six questions that Edcite’s Summary Report will answer for you- instead of wasting time running numbers, you can move efficiently into “what to do” to support and celebrate students!

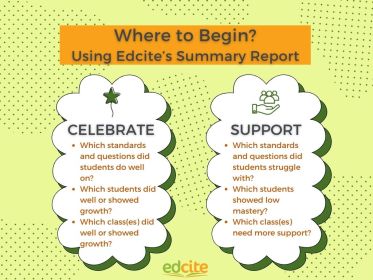
- Success: What will we celebrate?
- Use the Question Details and Standards Details graphs to see which questions and standards students did well on. Celebrating these wins whole-group will help students see the wins!
- Scroll down and view the Aggregate Data by student to see which specific students to celebrate. Who did well on this assignment? Who met their individual goal(s)? Celebrating individual students can help with feelings of confidence and belonging in your class!
- You can also view data by class- some teachers love to use this as a way to encourage healthy competition and celebrate the classes with the most growth and/or highest achievement.
- Support: Where can I support students?
- Use the Question Details and Standards Details graphs to show you which questions and standards are the lowest. On the Question Details, if students tested online, you can also see the average time spent on each question (the yellow line). From here, use the Item Analysis report for those lower questions to plan your re-teach.
- Scroll down and view the Aggregate Data by student to see which students might need additional support. Who scored lower than normal on this exam? Who has consistently been showing low mastery, and what support do they need? You can dig into this more with the Performance Band and Dynamic reports.
- You can also view data by class, which allows you to see which class periods need more interventions, and which are ready for some enrichment!
With just this one report on Edcite, you’re able to move to action to support and celebrate students, because what you do about the data is what matters!
Click here for an in depth guide to using the summary report!
About the Author

Kat Strickland Rodriguez joined TFA in 2008 and worked in her placement district in the Rio Grande Valley for the next twelve years. She taught ELA before becoming an Assistant Principal of Instruction, and then earned her masters in Leadership from Columbia Teachers College before founding IDEA Harlingen College Prep in 2020. Kat transitioned to the Edcite team in 2024 and is passionate about serving educators with access to quality assessments and analytics that help adults make informed decisions so kids can excel!
Leave a Reply